Computer Architecture & Logic Visualizer
Interactive LC-3, floating point, and K-map learning tool
Start: December 2024 • End: January 2025
Interactive LC-3, floating point, and K-map learning tool
Start: December 2024 • End: January 2025
This project is an interactive visualizer designed to trace LC-3 instruction execution, visualize floating point arithmetic, and show how to simplify logic using K-maps. Over my winter break, I created an interactive visualizer to help students learn about how instructions are run on a processor. After I became a TA (teaching assistant) for the course CS 2110 (Computer Organization and Programming), I reached out to the head TAs and worked with the Tech team lead, Henry Bui, on deploying this app for the students of the course. In the summer of 2025, I added the IEEE and K-map visualizers along with a home screen.
Respectfully, I give credit to Henry Bui for his contributions of the side pseudocode pop-up, coloring, Vue refactoring, a much improved control bar (at the bottom of the LC3 page), his assistance on setting up the CI/CD pipeline for deployment, and his suggestions throughout the process.
Out of all of the projects that I have created, this is undeniabilty my favorite. This was the first personal project that I had completed and as a TA, I was able to watch 800+ students use my tool to learn. I'm proud to have left a mark in a course that I love to teach.
1) Learned basic web development Using online resources, I self-taught myself HTML, CSS, and JavaScript in the course of around 1.5 weeks.
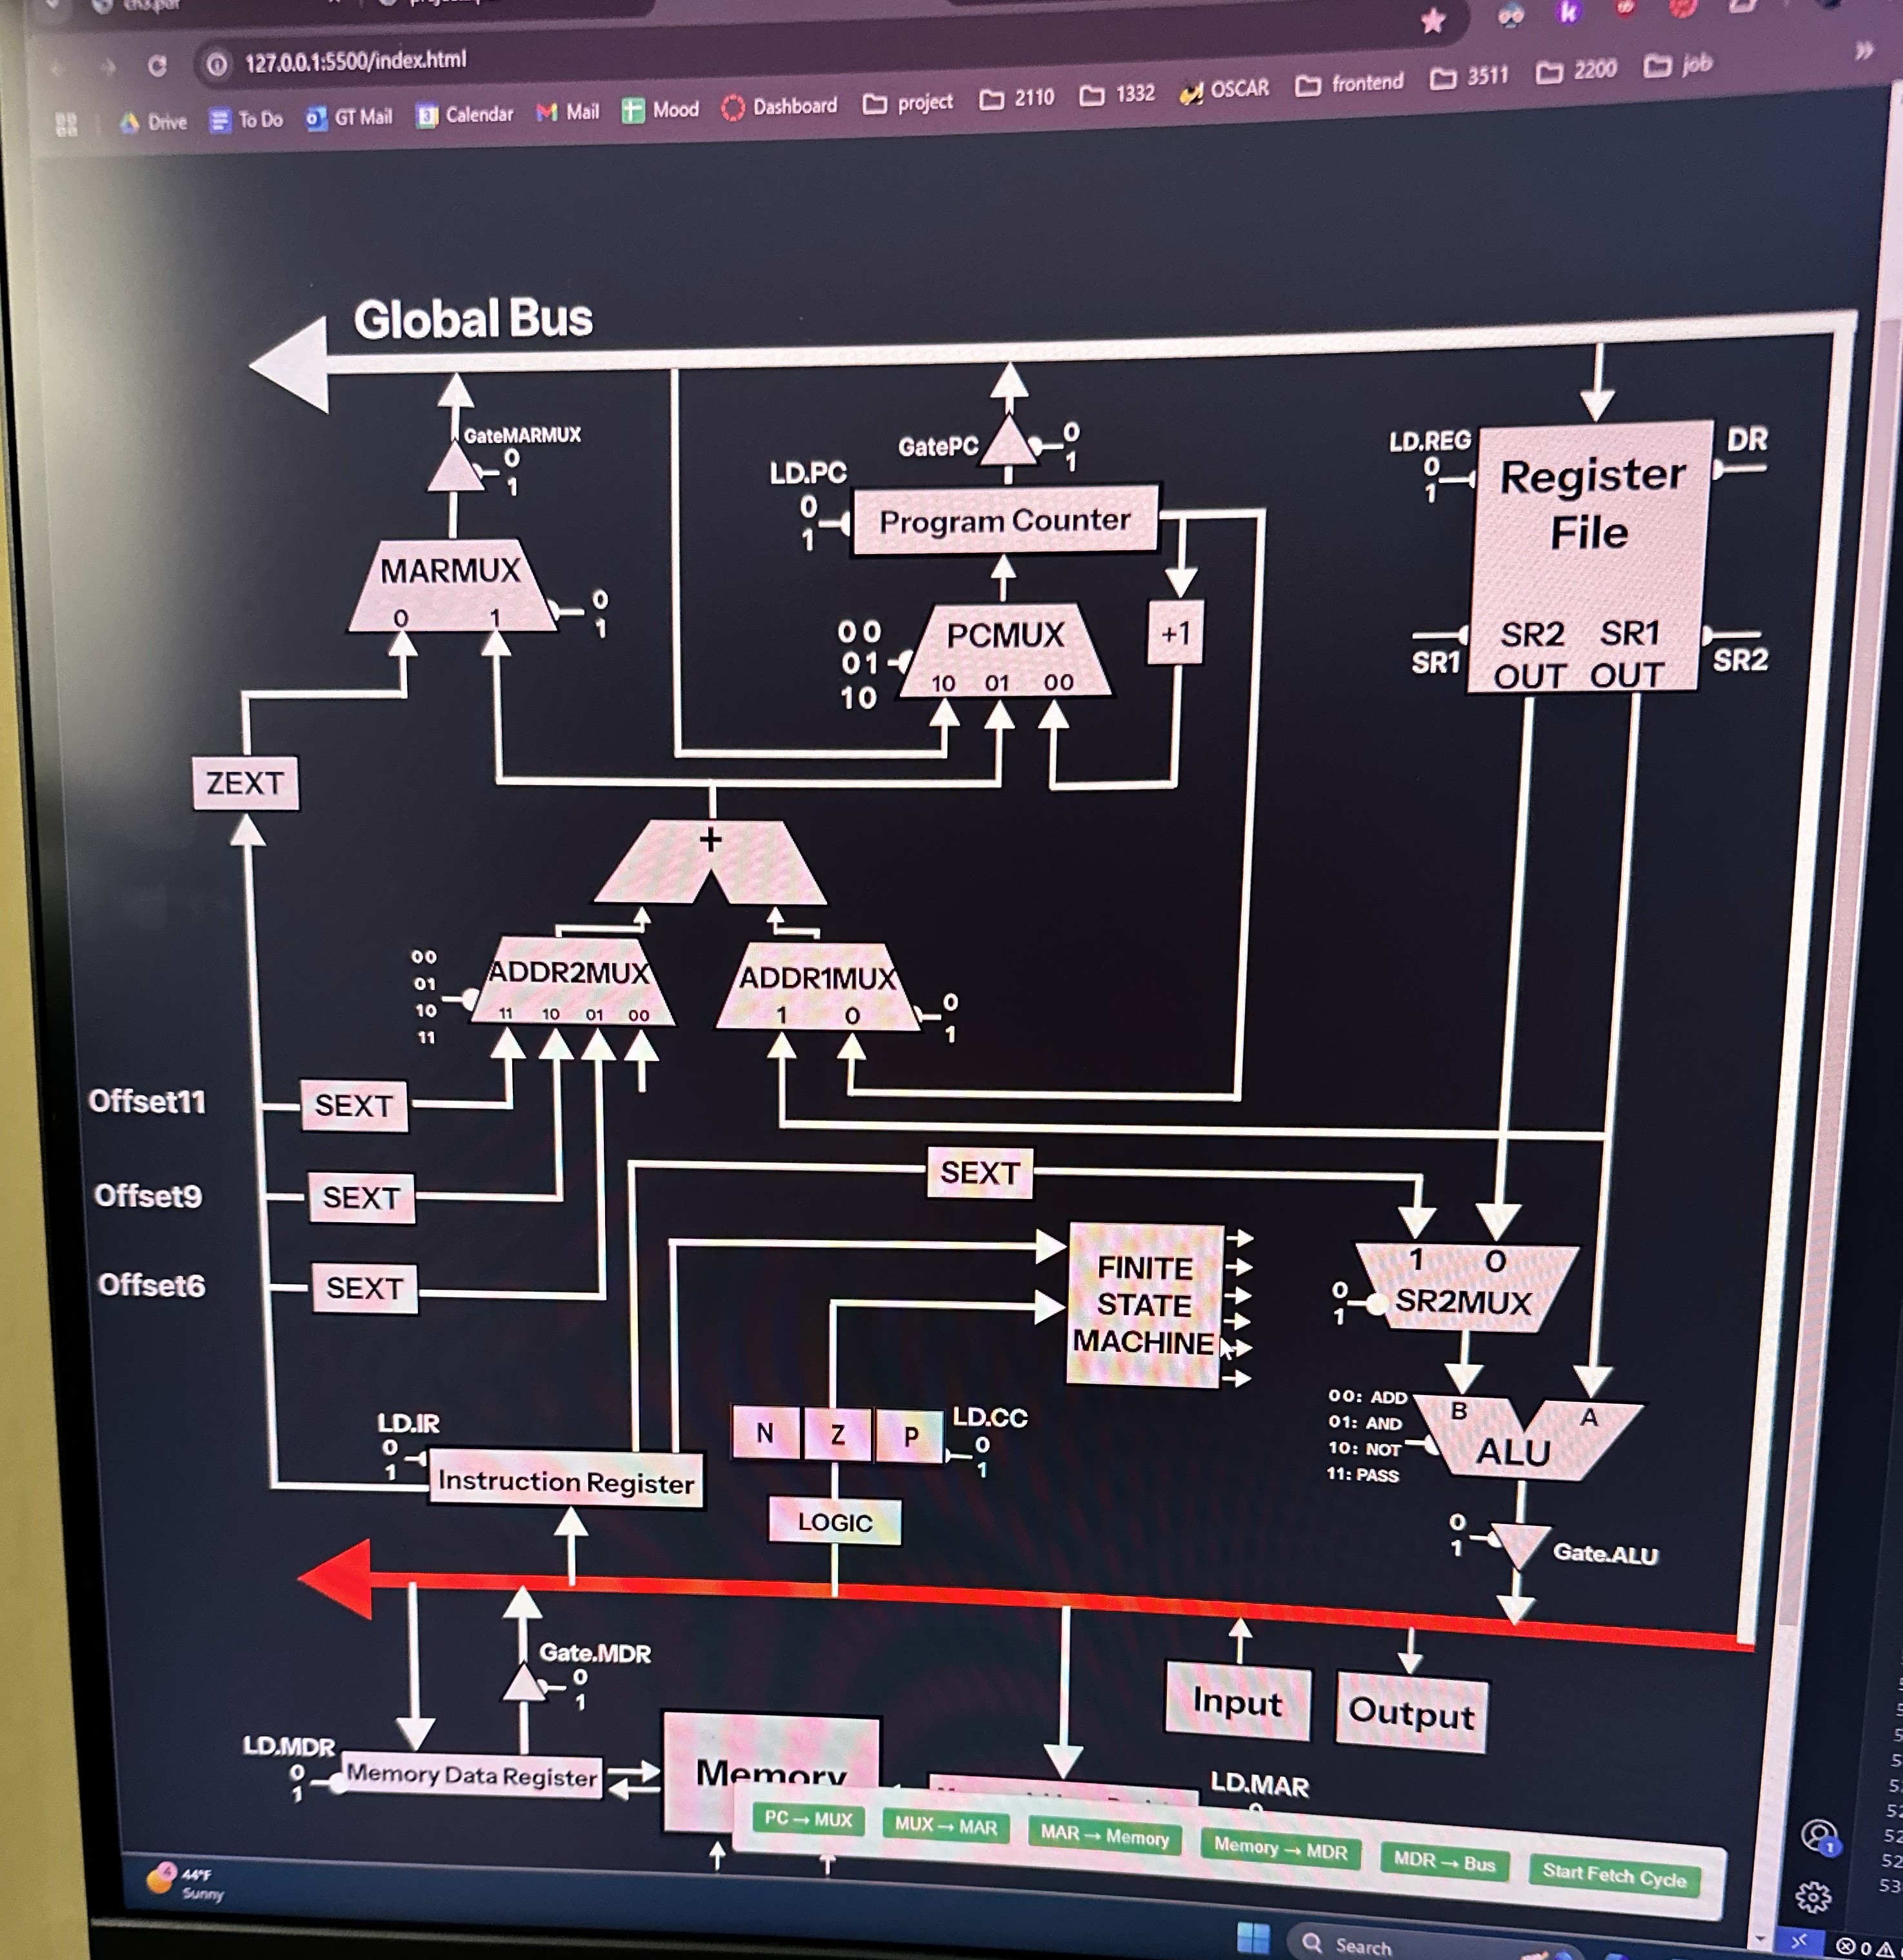
2) Developed the LC3 Model on Figma. After horribly failing to recreate the LC3 Model using vanilla HTML, I researched possible solutions and discovered SVGs (scalable vector graphics) on Figma. Because you can apply a CSS attribute to them, I'd be able to make certain lines/arrows in the diagram blink red to simulate dataflow. I used Figma components to recreate the model in around a week and had to assign each of them an identifiable, unique name so I can reference it in the code. I then imported my SVG into code in src/components/LC3.vue within the code repository.
3) Implemented instruction tracing. Throughout the course of another week, I made assigned each LC3 assembly instruction a sequence list of the names of SVG components that I wanted to highlight in a specific order (this is where creating good names was important). The sequence order of each instruction was not public, so I referenced my previous LC3 tracing assignments in CS 2110. The tracings can be found in src/projects/LC3/sequences.ts within the code repository.
4) Vue refactoring + Deployment via CI/CD. By this point, the basic product was finished. I contact Henry Bui (the Tech team lead of CS 2110) and he approved of the project for the course and began assisting with deployment by refactoring to Vue.js and setting up the CI/CD pipeline.
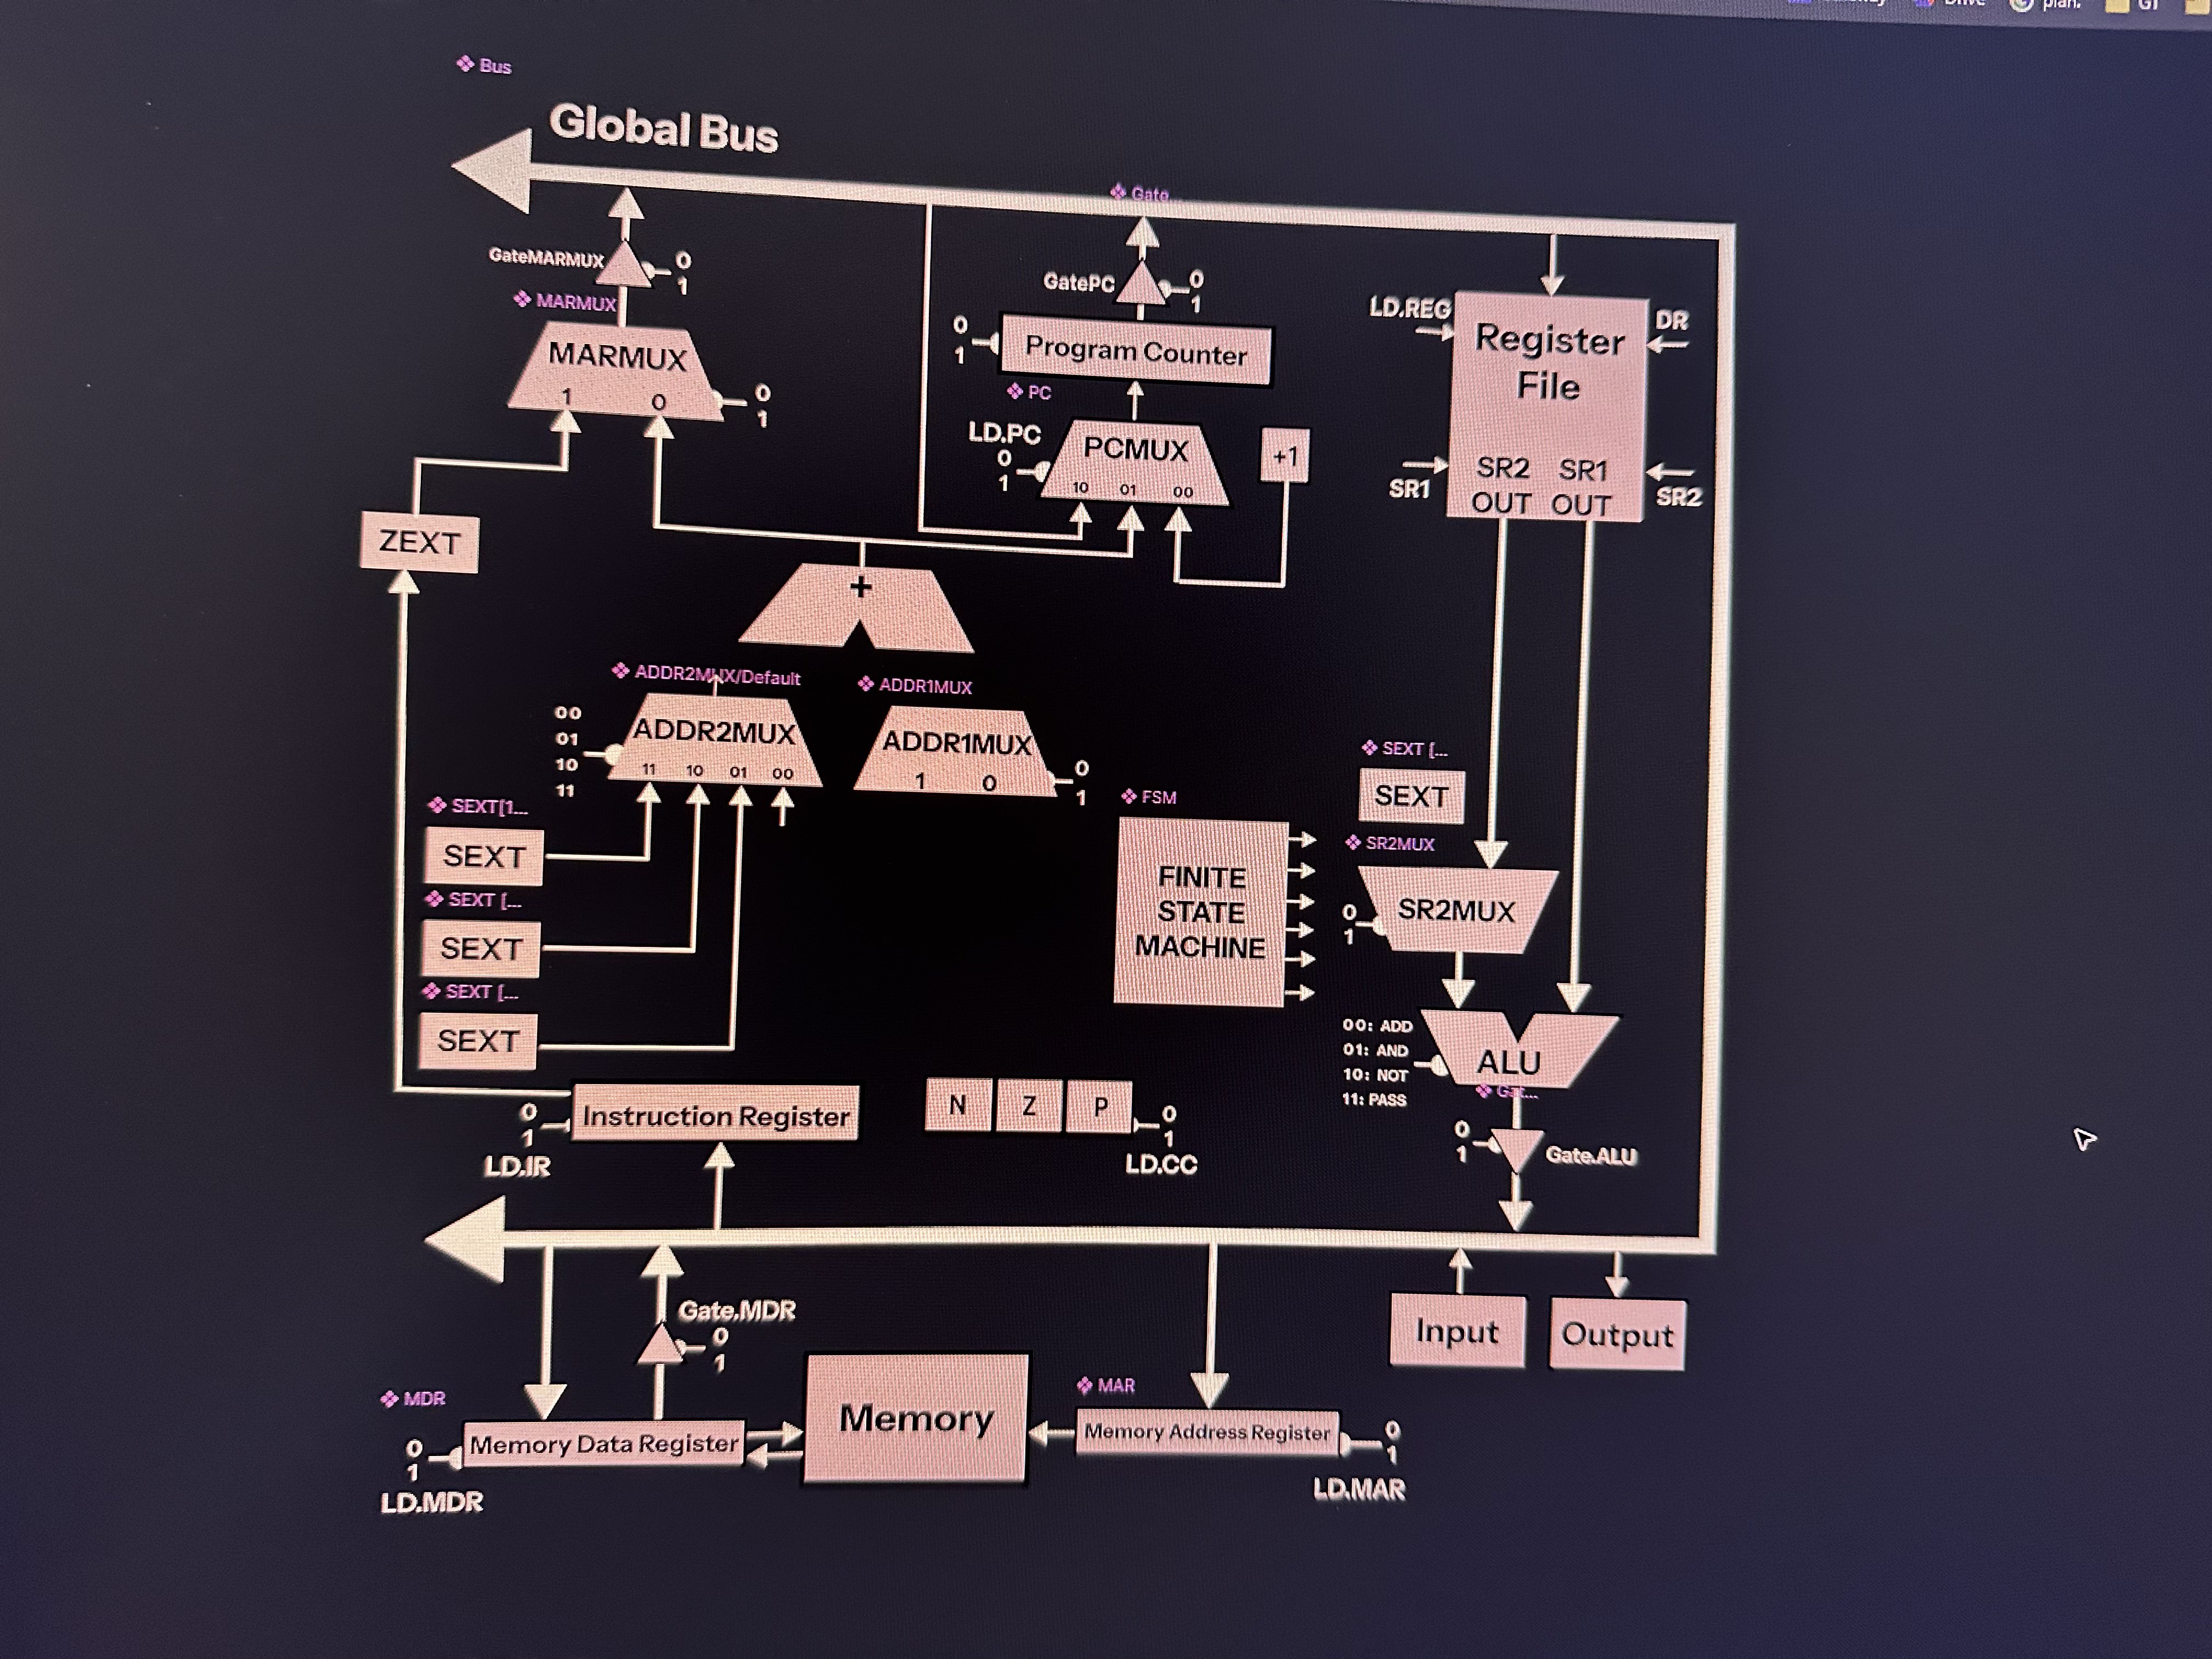
Stage: Halfway through building LC-3 model via SVGs
Stage: First successful highlighting of an SVG component!
Stage: First successful simulation!
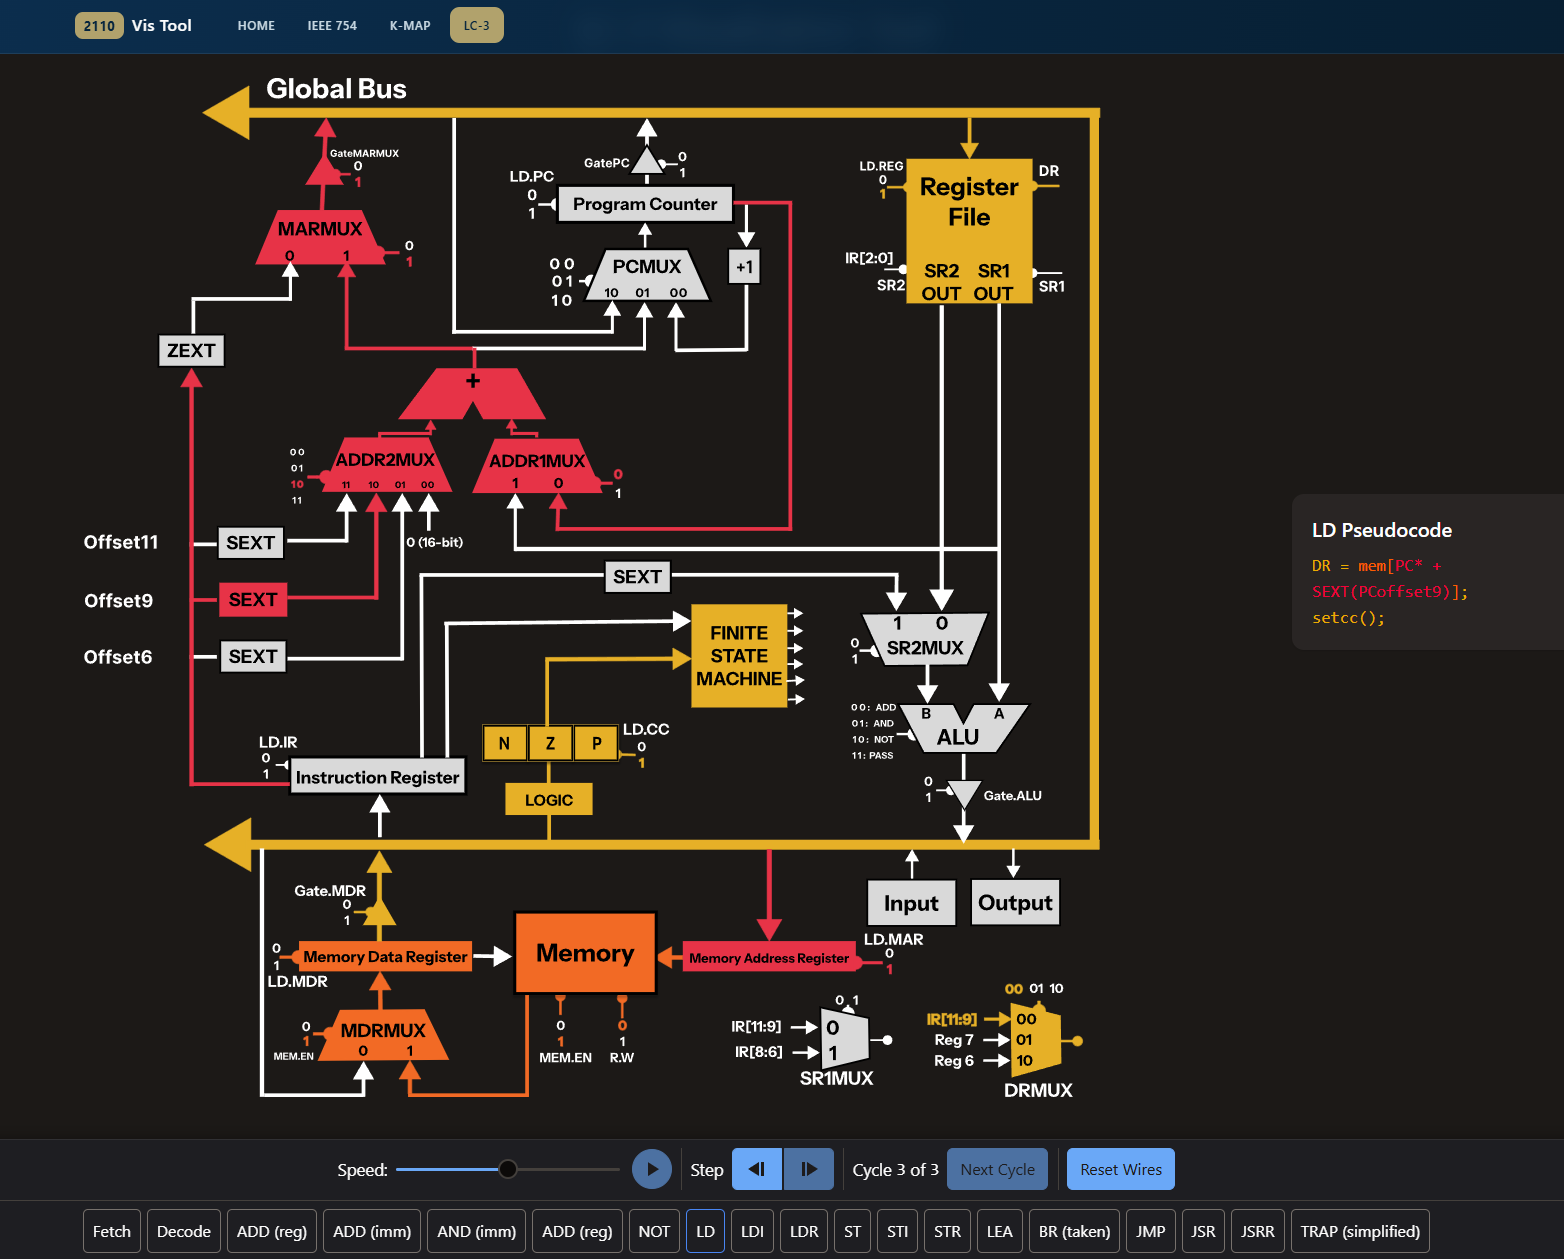
Interactive instruction execution view to help students learn how instructions are run on the LC3 processer per cycle.
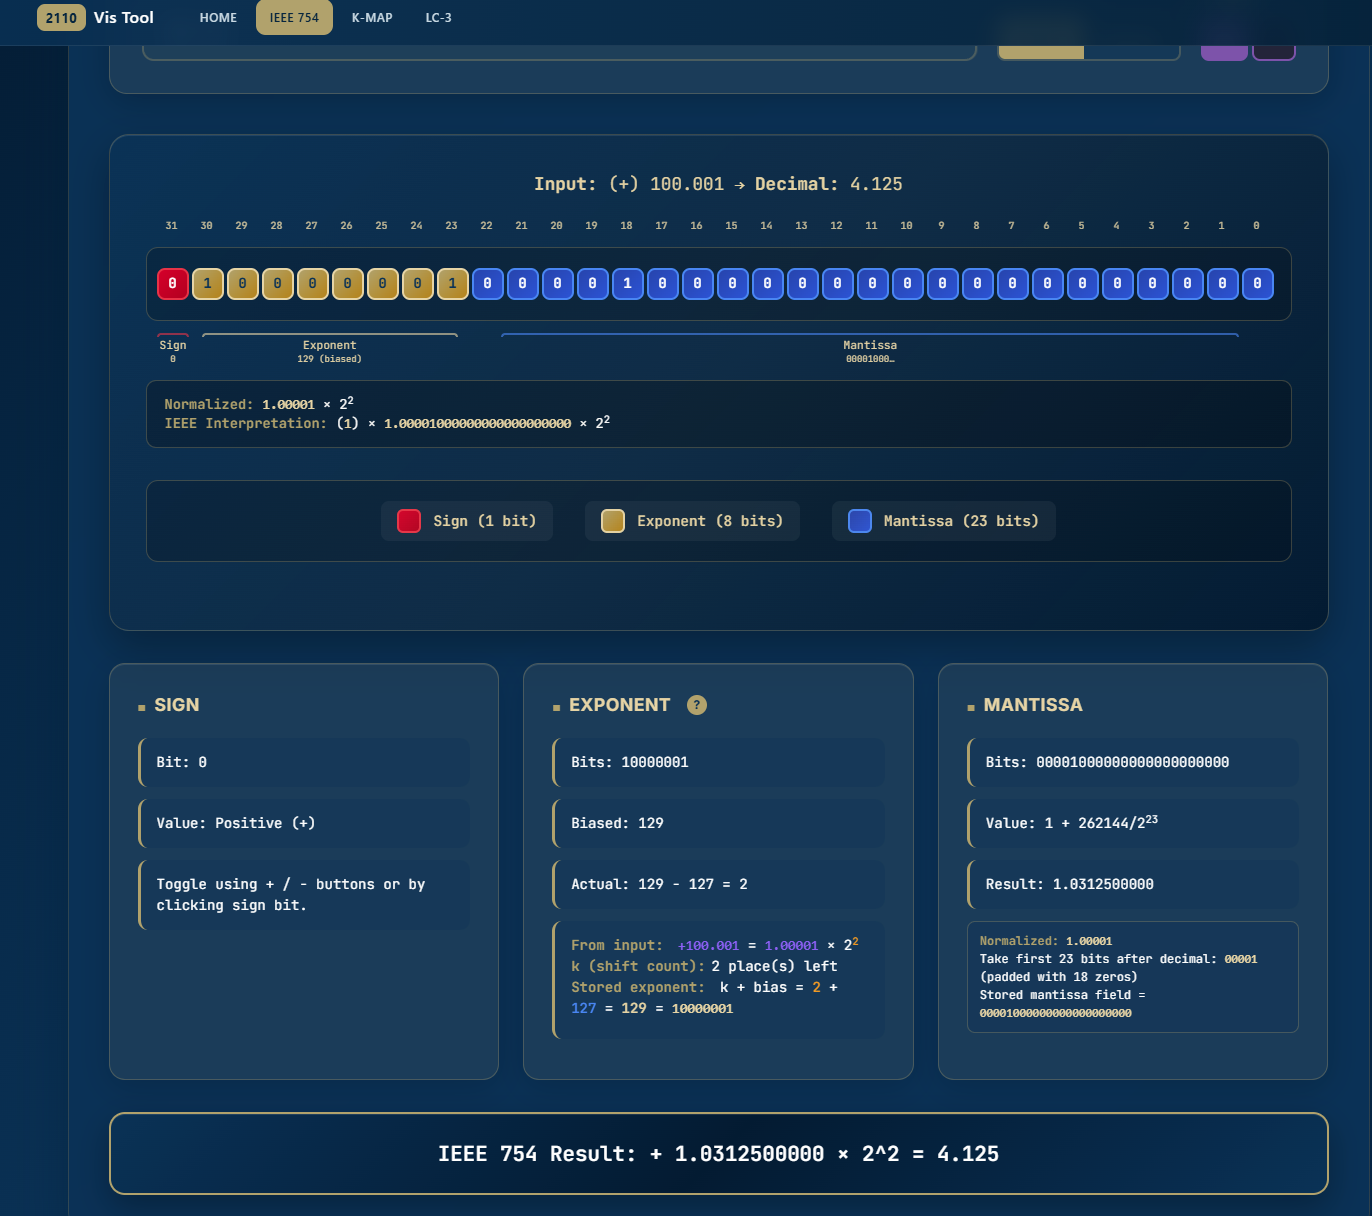
Visualization tooling to understand the calculations from binary/decimal to IEEE floating point representation.
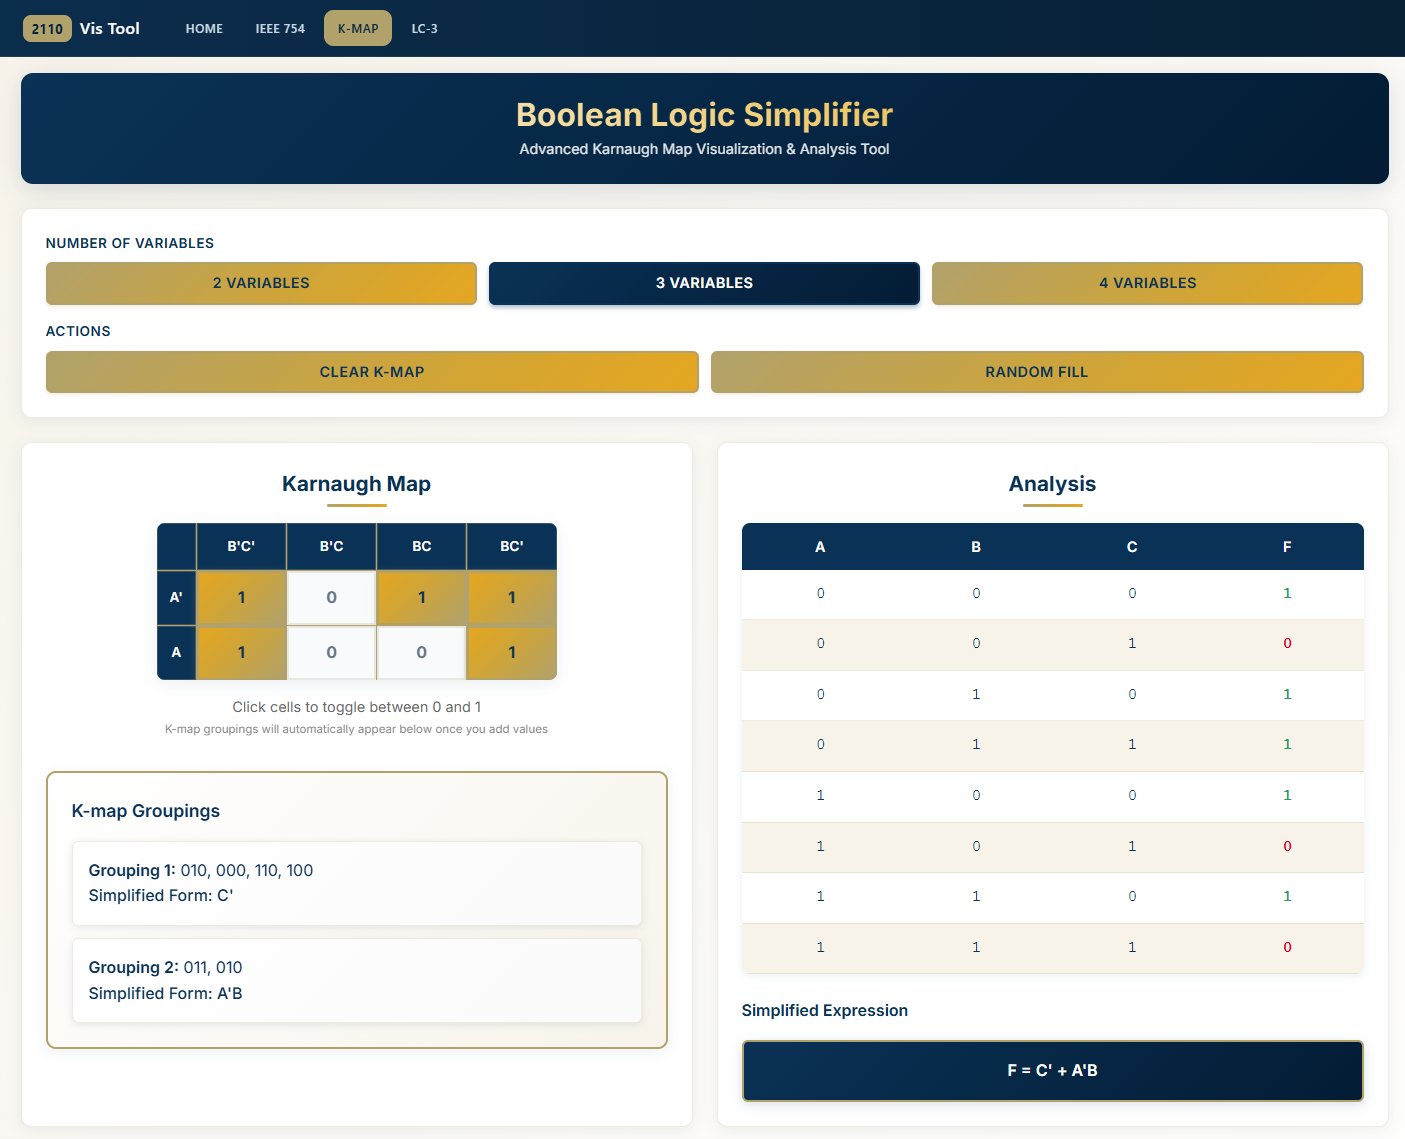
Visualiztion tooling for logic simplification via Karnaugh maps to connect truth tables to minimized expressions.
CI/CD pipeline deploys updates to GitHub Pages so users always have the latest version.
Challenge: The first, and biggest, challenge was figuring out how to create the LC3 model. Initially, I attempted creating the model using Vanilla HTML. This was a horrible idea. Here is a picture of my attempt:
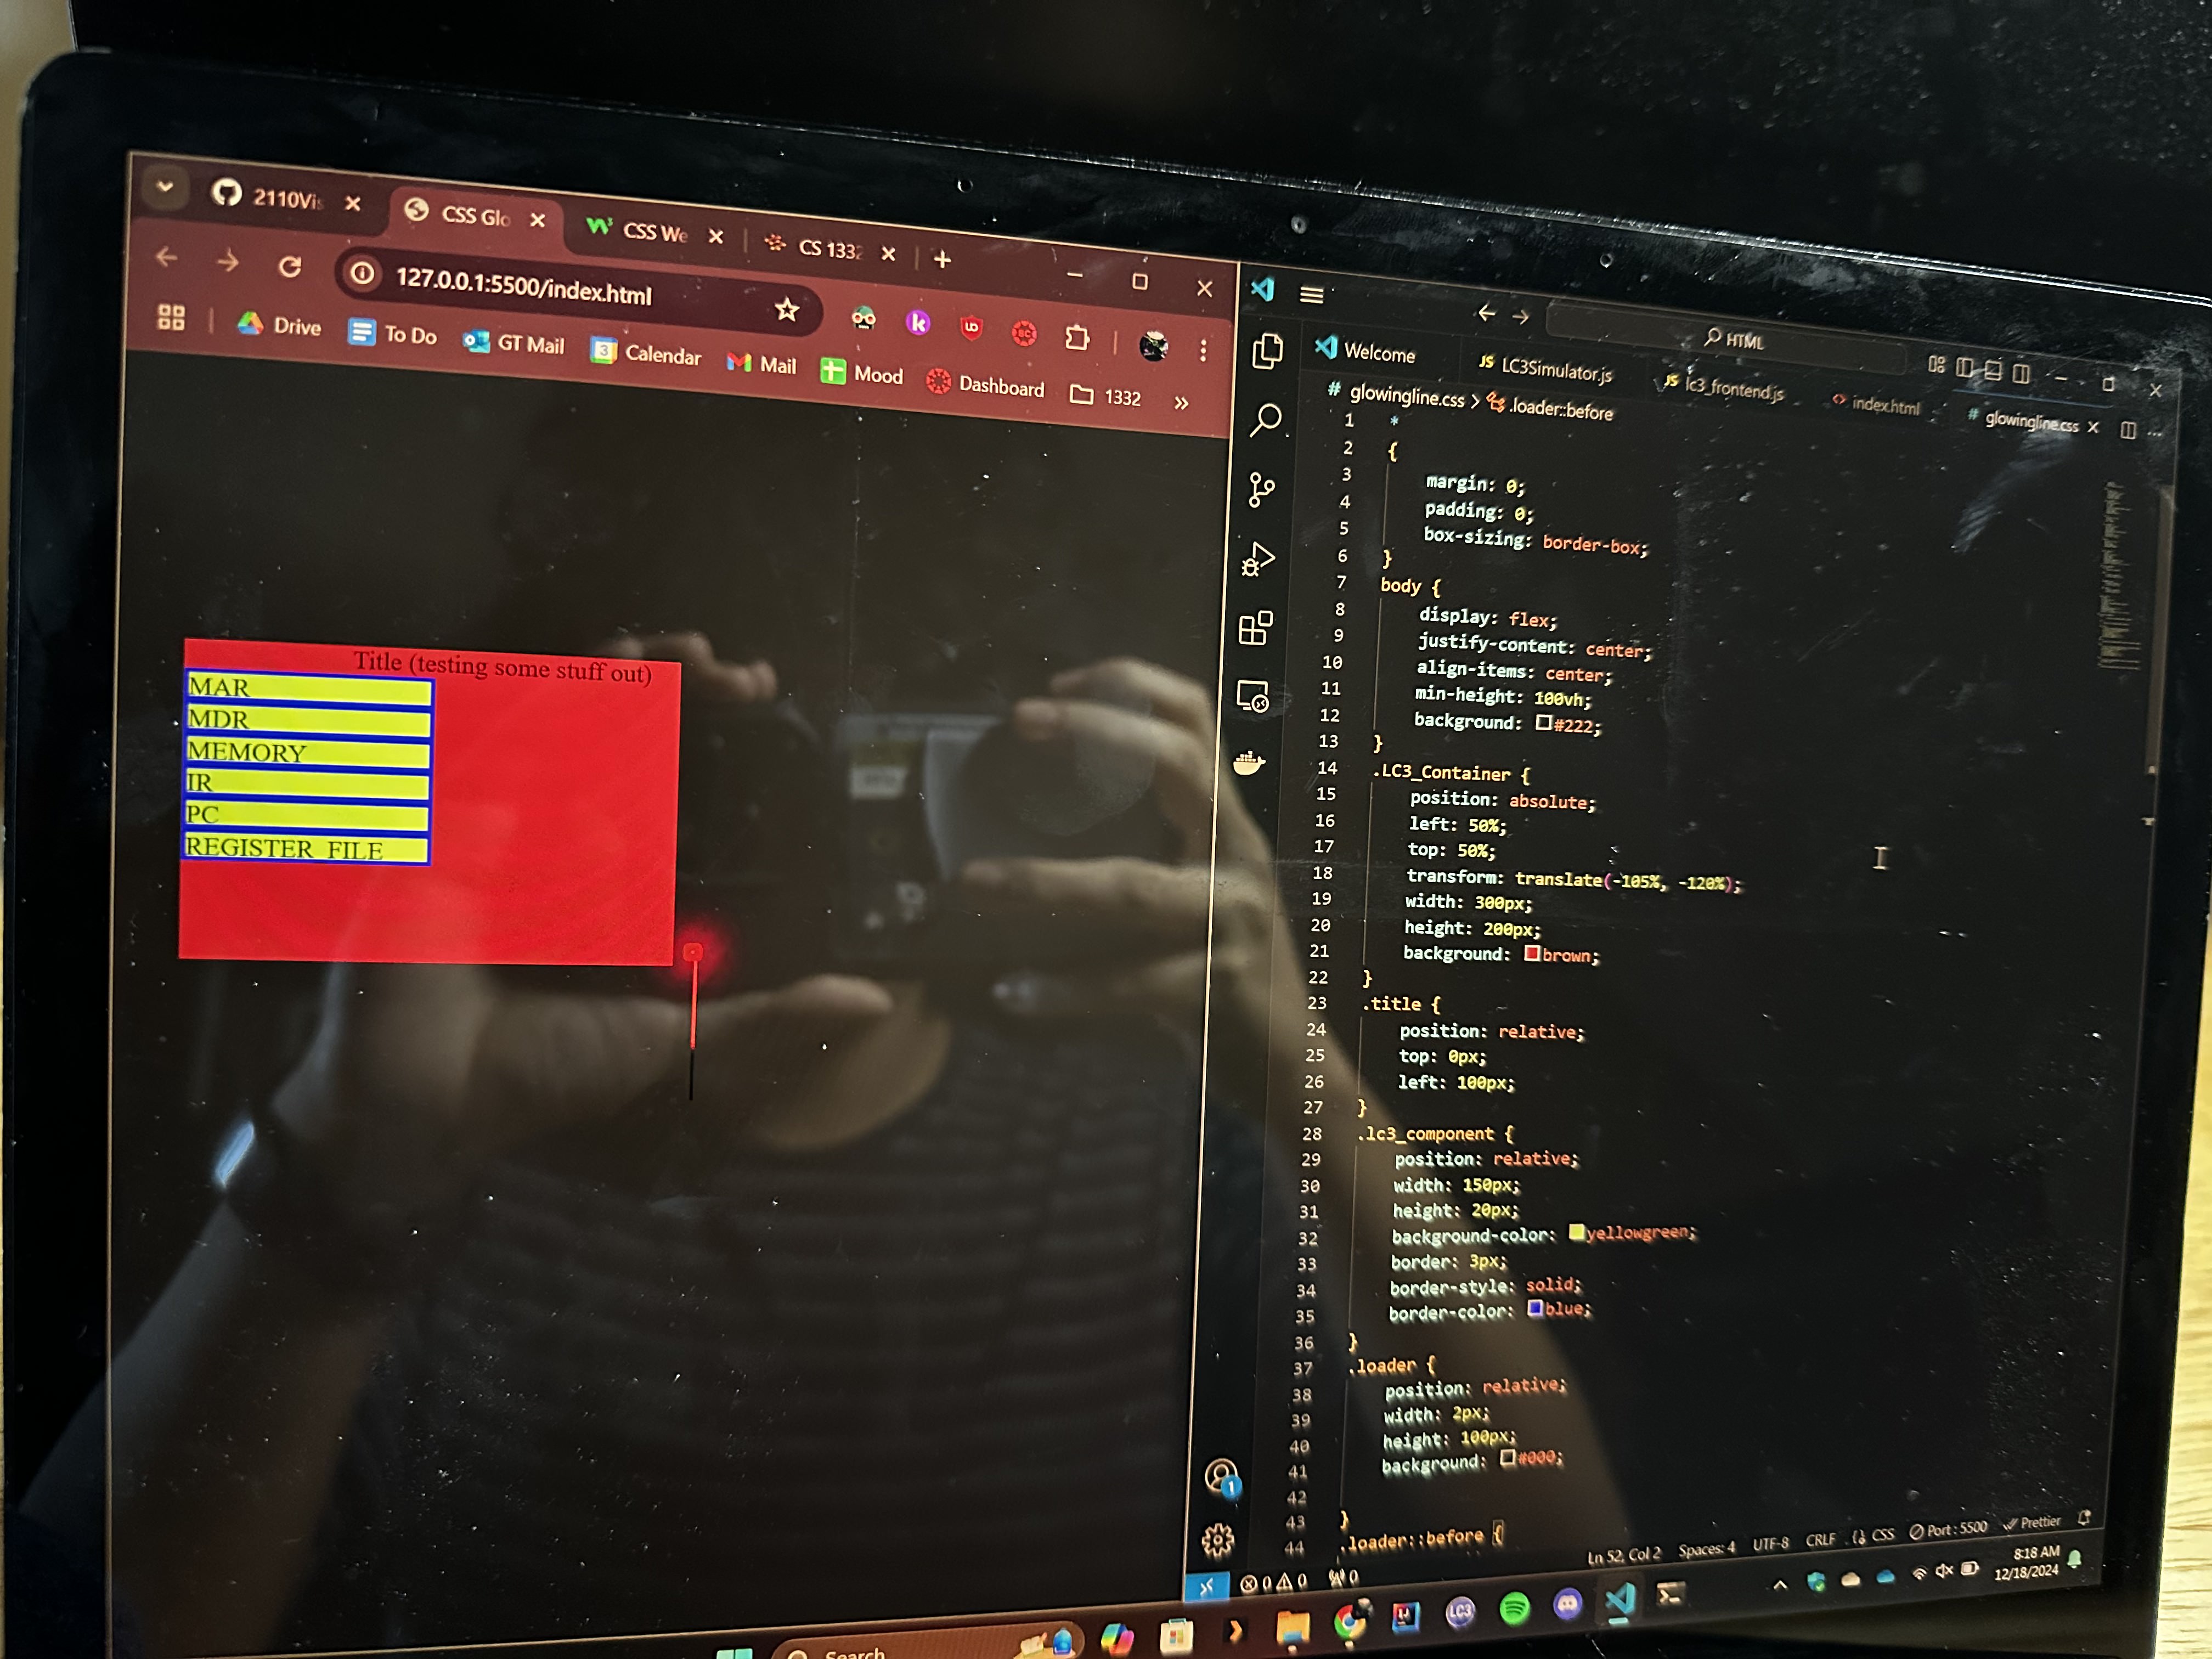
Solution: I researched and tested different methods for developing shapes that I can represent in code and discovered SVGs in Figma.